

This R tutorial describes how to create a box plot using R software and ggplot2 package.
The function geom_boxplot() is used. A simplified format is :
geom_boxplot(outlier.colour="black", outlier.shape=16, outlier.size=2, notch=FALSE)ToothGrowth data sets are used :
# Convert the variable dose from a numeric to a factor variable ToothGrowth$dose ## len supp dose ## 1 4.2 VC 0.5 ## 2 11.5 VC 0.5 ## 3 7.3 VC 0.5 ## 4 5.8 VC 0.5 ## 5 6.4 VC 0.5 ## 6 10.0 VC 0.5Make sure that the variable dose is converted as a factor variable using the above R script.
library(ggplot2) # Basic box plot p
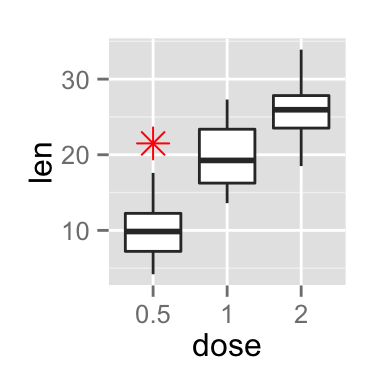
The function stat_summary() can be used to add mean points to a box plot :
# Box plot with mean points p + stat_summary(fun.y=mean, geom="point", shape=23, size=4)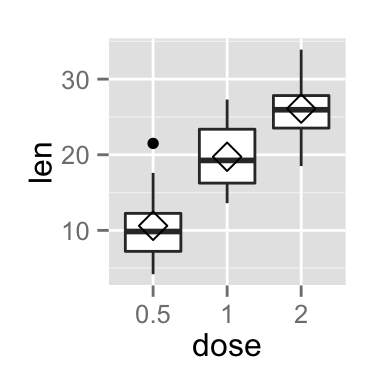
Choose which items to display :
p + scale_x_discrete(limits=c("0.5", "2"))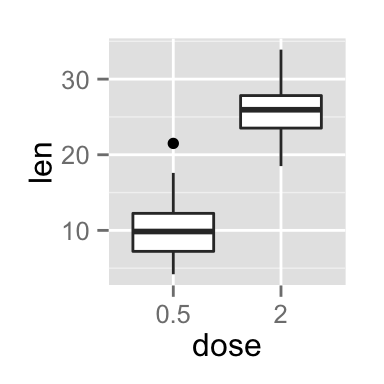
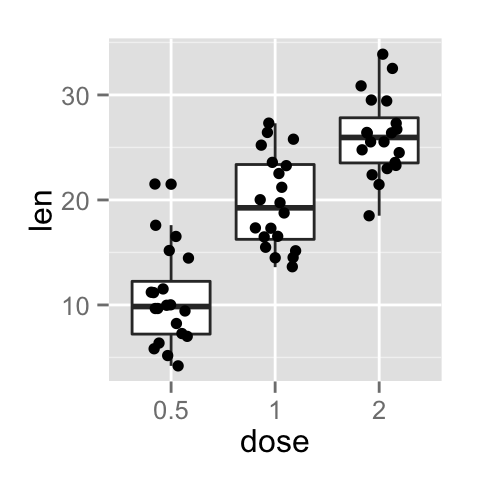
Dots (or points) can be added to a box plot using the functions geom_dotplot() or geom_jitter() :
# Box plot with dot plot p + geom_dotplot(binaxis='y', stackdir='center', dotsize=1) # Box plot with jittered points # 0.2 : degree of jitter in x direction p + geom_jitter(shape=16, position=position_jitter(0.2))
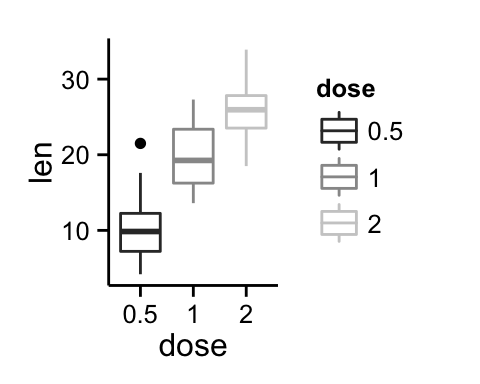
Box plot line colors can be automatically controlled by the levels of the variable dose :
# Change box plot line colors by groups p<-ggplot(ToothGrowth, aes(x=dose, y=len, color=dose)) + geom_boxplot() p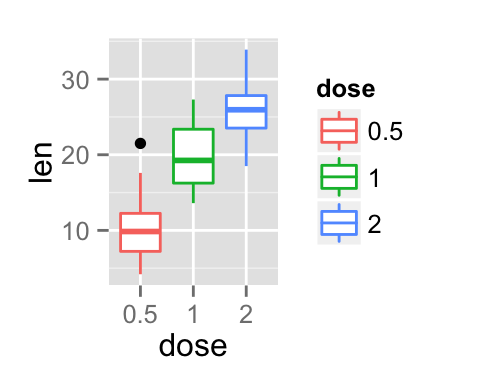
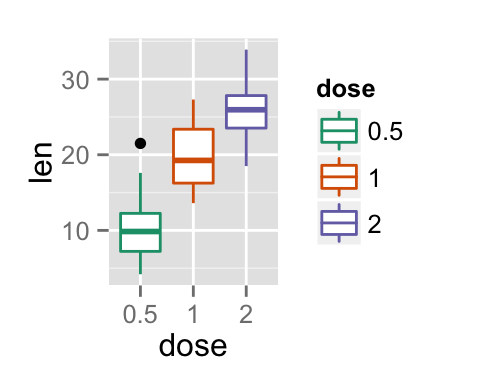
It is also possible to change manually box plot line colors using the functions :
# Use custom color palettes p+scale_color_manual(values=c("#999999", "#E69F00", "#56B4E9")) # Use brewer color palettes p+scale_color_brewer(palette="Dark2") # Use grey scale p + scale_color_grey() + theme_classic()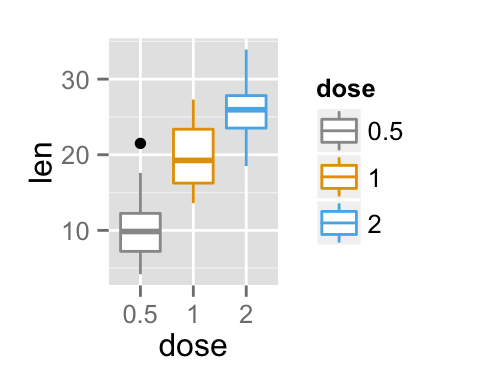
Read more on ggplot2 colors here : ggplot2 colors
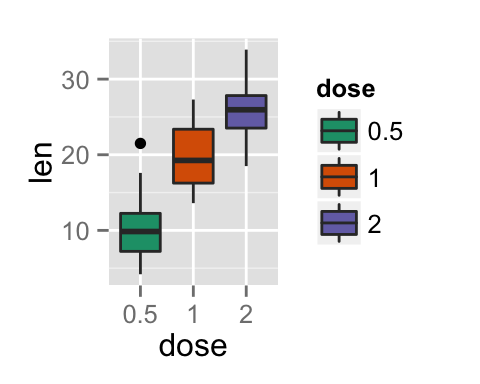
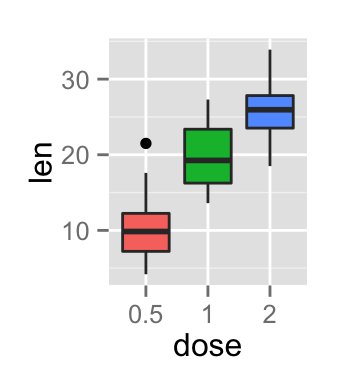
In the R code below, box plot fill colors are automatically controlled by the levels of dose :
# Use single color ggplot(ToothGrowth, aes(x=dose, y=len)) + geom_boxplot(fill='#A4A4A4', color="black")+ theme_classic() # Change box plot colors by groups p<-ggplot(ToothGrowth, aes(x=dose, y=len, fill=dose)) + geom_boxplot() p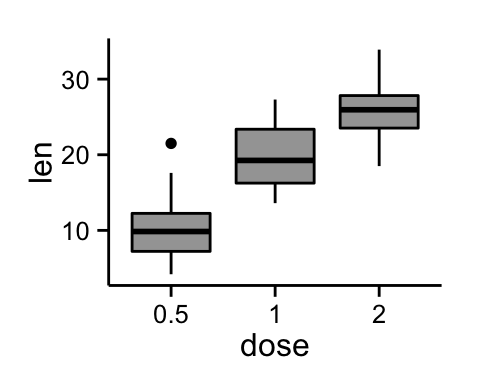
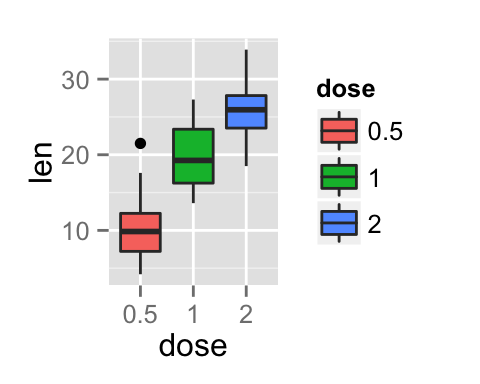
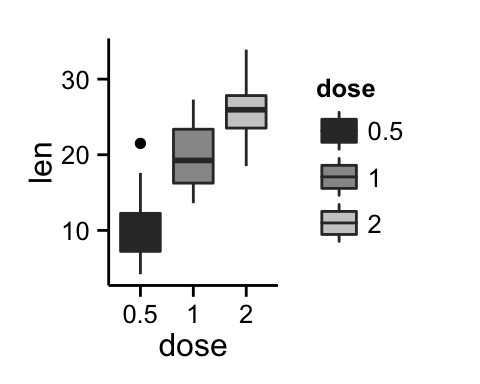
It is also possible to change manually box plot fill colors using the functions :
# Use custom color palettes p+scale_fill_manual(values=c("#999999", "#E69F00", "#56B4E9")) # use brewer color palettes p+scale_fill_brewer(palette="Dark2") # Use grey scale p + scale_fill_grey() + theme_classic()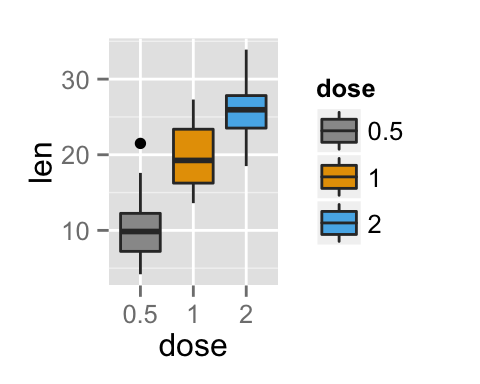
Read more on ggplot2 colors here : ggplot2 colors
p + theme(legend.position="top") p + theme(legend.position="bottom") p + theme(legend.position="none") # Remove legend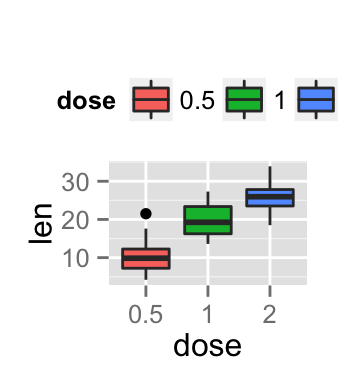
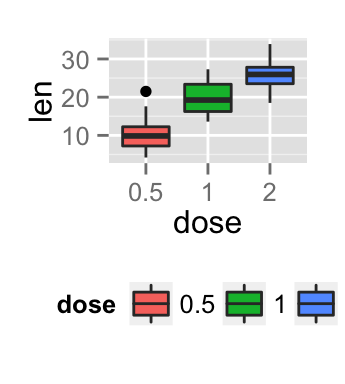
The allowed values for the arguments legend.position are : “left”,“top”, “right”, “bottom”.
Read more on ggplot legend : ggplot2 legend
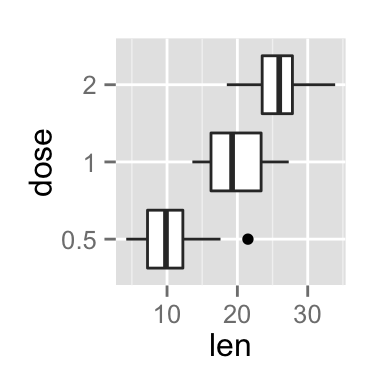
The function scale_x_discrete can be used to change the order of items to “2”, “0.5”, “1” :
p + scale_x_discrete(limits=c("2", "0.5", "1"))
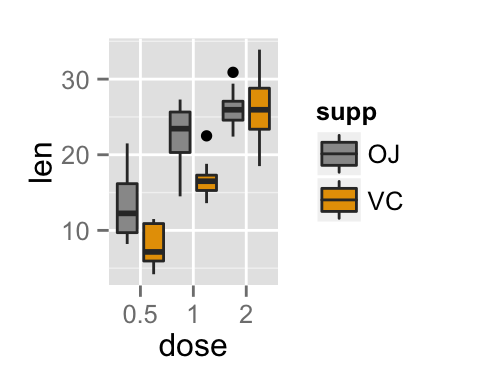
# Change box plot colors by groups ggplot(ToothGrowth, aes(x=dose, y=len, fill=supp)) + geom_boxplot() # Change the position p<-ggplot(ToothGrowth, aes(x=dose, y=len, fill=supp)) + geom_boxplot(position=position_dodge(1)) p

Change box plot colors and add dots :
# Add dots p + geom_dotplot(binaxis='y', stackdir='center', position=position_dodge(1)) # Change colors p+scale_fill_manual(values=c("#999999", "#E69F00", "#56B4E9"))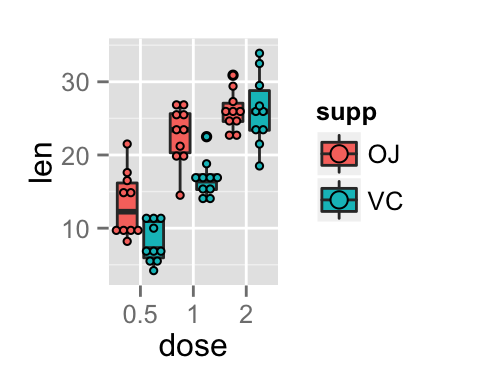
# Basic box plot ggplot(ToothGrowth, aes(x=dose, y=len)) + geom_boxplot(fill="gray")+ labs(title="Plot of length per dose",x="Dose (mg)", y = "Length")+ theme_classic() # Change automatically color by groups bp 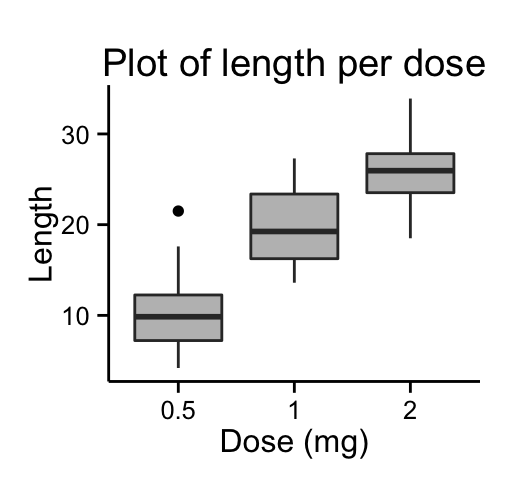

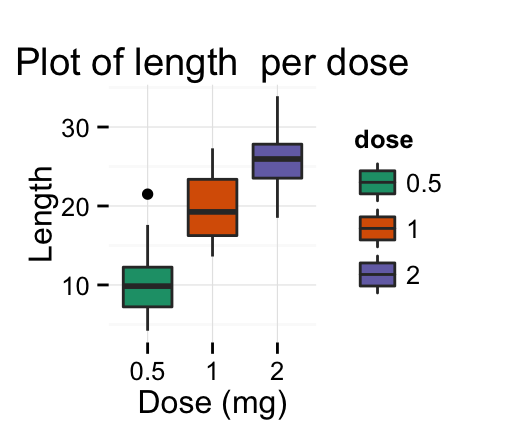
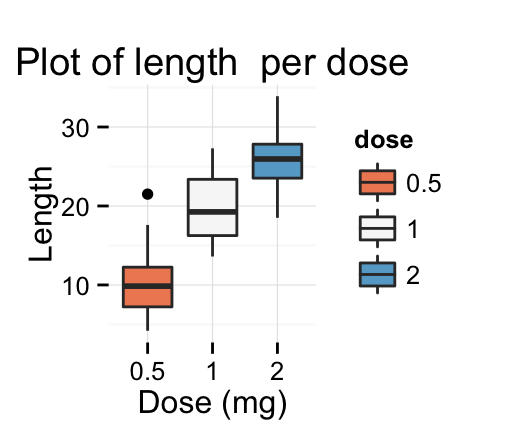
Change fill colors manually :
# Continuous colors bp + scale_fill_brewer(palette="Blues") + theme_classic() # Discrete colors bp + scale_fill_brewer(palette="Dark2") + theme_minimal() # Gradient colors bp + scale_fill_brewer(palette="RdBu") + theme_minimal()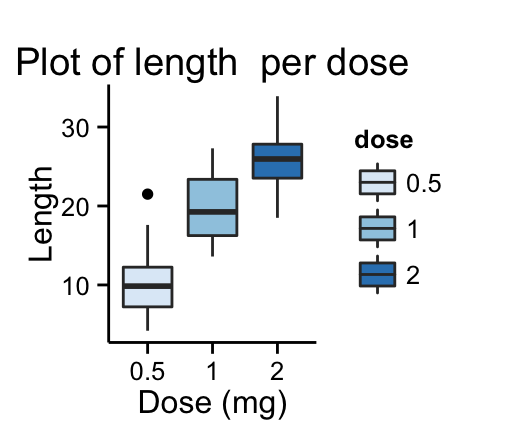
Read more on ggplot2 colors here : ggplot2 colors
This analysis has been performed using R software (ver. 3.1.2) and ggplot2 (ver. 1.0.0)
Enjoyed this article? I’d be very grateful if you’d help it spread by emailing it to a friend, or sharing it on Twitter, Facebook or Linked In.
Show me some love with the like buttons below. Thank you and please don't forget to share and comment below!!
Avez vous aimé cet article? Je vous serais très reconnaissant si vous aidiez à sa diffusion en l'envoyant par courriel à un ami ou en le partageant sur Twitter, Facebook ou Linked In.
Montrez-moi un peu d'amour avec les like ci-dessous . Merci et n'oubliez pas, s'il vous plaît, de partager et de commenter ci-dessous!